The prevalence of microservice architecture in software systems has been growing for over a decade now. And most industry professionals are familiar with its key ‘ity benefits: flexibility, scalability, reliability, etc. Those in hands-on roles are also familiar with some of the key challenges sources in its atomic level independence. When something goes wrong, it can be difficult to decipher the cause from the symptoms and working through the vast catalog of microservices that are present in most enterprise software systems can feel like navigating blindfolded through a maze.
Navigating the microservices maze is where Dynatrace becomes an indispensable ally. Dynatrace is a software visibility platform designed to help organizations monitor, optimize, and manage the performance of their applications, infrastructure, and digital experiences. We use it primarily for system support but it has a broad array of uses.
Join us as we delve into several specific features of the Dynatrace platform and describe how those can benefit your enterprise software development and support activities.
Optimizing Microservices with Dynatrace
Real-time Monitoring of Microservices
Dynatrace offers an integrated suite of tools engineered for the nuanced demands of continuous cloud environment monitoring. Its suite includes Application Performance Monitoring (APM), Real User Monitoring (RUM), Synthetic Monitoring, Network Monitoring, and Infrastructure Monitoring.
- Application Performance Monitoring (APM): APM ensures the seamless functionality of applications by tracking and analyzing their performance. It delves into code-level details, providing insights into transaction traces, database queries, and external service calls, enabling fast identification and resolution of performance bottlenecks.
- Real User Monitoring (RUM): RUM captures and analyzes user interactions with applications in real-time. By monitoring users’ actual experiences, it offers invaluable insights into page load times, click paths, and user satisfaction, aiding in the optimization of the user interface and overall application performance.
- Synthetic Monitoring: This component proactively simulates user interactions with applications, helping to identify potential issues before they impact real users. It automates tests across various scenarios, ensuring that applications perform optimally under diverse conditions, contributing to enhanced reliability and user satisfaction.
- Network Monitoring: Focusing on the network infrastructure, this component monitors the health and performance of network elements. It provides visibility into latency, packet loss, and bandwidth utilization, enabling swift identification of network-related issues that may impact application performance.
- Infrastructure Monitoring: Infrastructure Monitoring oversees the health and performance of underlying systems, including servers, virtual machines, and containers. It tracks resource utilization, system metrics, and dependencies, ensuring a comprehensive understanding of the infrastructure’s contribution to overall application performance.
Dynatrace provides real-time insights and detailed analytics, helping you optimize your cloud operations effectively. It’s a crucial tool for navigating the complexities of modern cloud setups, ensuring everything runs smoothly.
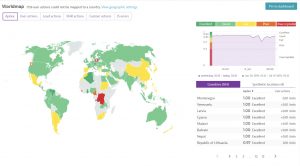
Figure 1: Real-time monitoring for application health
Here’s an example of an error view provided by Dynatrace. It offers a concise overview of errors within a system, including type, frequency, impacted services, and root causes.

Figure 2: Error view example
Distributed Tracing for End-to-End Visibility
Dynatrace integrates advanced distributed tracing functionality, offering comprehensive visibility into microservices interactions and external dependencies. This feature traces requests across the entire microservices landscape, identifying bottlenecks, latency issues, and complex dependencies for efficient debugging. Dynatrace’s technical expertise in distributed tracing streamlines troubleshooting, allowing precise insights into request paths and performance characteristics, optimizing overall microservices performance and reliability.
AI-powered Insights for Anomaly Detection
Dynatrace simplifies the complexity involved in monitoring and optimizing distributed systems by identifying potential problems such as memory leaks, spiking CPU usage, network latencies, configuration errors, and database bottlenecks. These capabilities underscore Dynatrace’s proficiency in ensuring optimal operations across the full spectrum of microservices architectures, by providing precise, actionable data to address issues that could degrade system performance or jeopardize system integrity.
Using smart auto-baselining and predictive analytics, Dynatrace effortlessly identifies anomalies, while AI swiftly assesses their potential impact on customers.

Figure 3: Impacted users analysis
Automated Root Cause Analysis
Leveraging a sophisticated cross-referencing system, Dynatrace analyzes an extensive array of diagnostic sources. These include but are not limited to real-time logs, precise metrics, and comprehensive traces. When combined, this diverse data set empowers the platform to trace anomalies back to their source accurately, even within the complexities of a distributed microservices architecture.
What truly distinguishes Dynatrace is its ability to not just detect that a problem exists but to intelligently diagnose the source rapidly. By doing so, it ensures that remedial action can be taken promptly, significantly curbing any potential downtime or degradation of service that users might experience.
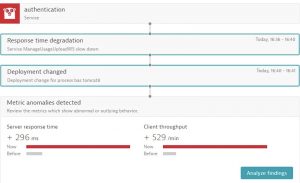
Figure 4: Root cause relevant findings
This proactive approach to incident management reinforces a seamless operational continuity, maintaining the integrity of digital services in an era where availability is critical.
Rescuing Efficiency: A Deep Dive into Dynatrace Features
It’s time to dive into the advanced features that make Dynatrace an unmatched force in the performance monitoring and optimisation space as we begin the second phase of our quest.
Before jumping into specific features, it’s vital to understand that Dynatrace’s strength lies in its comprehensive approach to monitoring and management. Its philosophy is based on automating as much as possible for smarter insights and facilitating collaboration between different teams.
Application and Service-Level Monitoring
Dynatrace’s advanced monitoring capabilities manifest in its ability to provide a comprehensive technical breakdown of each individual microservice’s performance. A careful analysis of important technical details is required for this breakdown, such as response times, error rates, and resource utilization. This level of granularity is instrumental for identifying not only where systems may be slowing down or encountering failures but also understanding the root causes behind these issues. Armed with precise technical information, teams can proactively troubleshoot problems, optimize resource allocation, and enhance the overall efficiency of the microservices architecture. In essence, Dynatrace’s technical depth empowers technical teams to go beyond surface-level observations, enabling them to make informed decisions for a more resilient and high-performing system.
User Experience Monitoring
In a microservices architecture, each service plays a critical role in the user experience. Dynatrace offers user experience monitoring that goes beyond simple page load times and HTTP response codes. Real User Monitoring in Dynatrace provides you with data on the actual performance users experience and not just the performance in a controlled environment. This is important because what works well in a local development environment might not necessarily translate to good performance in the real world.
Infrastructure Monitoring
Through Dynatrace, you gain the ability to monitor essential metrics such as CPU load, memory usage, disk activity, and network throughput across various components like servers, containerized applications, and cloud infrastructure.
This robust monitoring suite is crafted to safeguard the performance and scalability of your microservices, delivering real-time insights and analytics.
Log Analytics and Management
Dynatrace enables seamless collection, analysis, and visualization of logs from microservices and their associated components. Leveraging Dynatrace’s log monitoring features, technical users can efficiently troubleshoot issues by correlating log data with performance metrics, gaining profound insights into the behavior of microservices applications.
Dynatrace streamlines troubleshooting processes by aggregating and filtering logs based on specific problems, providing a clear path for technical users to understand and resolve underlying causes.
Our Experience with Dynatrace
At RIA Solutions Group, we have lived the before and after experience and will attest to the benefits of software observability platforms like Dynatrace. In the before times, end user reports of “slow system performance” meant looking through log files for indicia of problems. This methodology was/is exceedingly time inefficient, especially at enterprise scale when microservices are often containerized and deployed to multiple instances, each with their own output log. This was us stumbling through the maze. In the after times, the triage process is streamlined by using Dynatrace to get a global view of the system and then zooming in to specific services to review the analytics captured: response times, failure rates, traffic volumes. And once a suspect(s) has been identified, we can zoom further down into the details down to the log level until the culprit(s) is found!
This article is not meant to endorse Dynatrace per se but rather to share our positive experience using a software observability platform. We have found this to have greatly reduced the time required to investigate and resolve systems issues and specifically system performance issues and highly encourage any group with microservices based enterprise software systems to adopt one.
Happy Coding!

Endre Szilagyi
Software Developer at RIA Solutions Group